Disclaimer

The articles in the blog are intended for informational purposes only, with the aim of encouraging thoughtful discussions. The articles should not be relied upon as financial advice. Please read the important disclaimer at the bottom of the page before proceeding.

Showing posts with label REITs. Show all posts

Impact of P/NAV ratios on acquisitions and rights issues


Earlier this week, I was having a conversation where I was trying to explain how some REITs are able to consistently make acquisitions and grow their AUM, while other REITs are not. My view is that the difference is mainly down to their price to net asset value (P/NAV) ratio which the market assigns to the REITs. REITs with P/NAV greater than 1 are able to take advantage of this cheaper cost of equity to make yield and NAV accretive acquisitions, whereas REITs with P/NAV at or below 1 are unable to do the same – acquisitions would often not be feasible as this would result in NAV and yield being dilutive.

I illustrate this with the examples below.


Let’s say we have two REITs, Reit A and Reit B. Both have similar properties valued at 1 mil, and generate a gross yield of 4%. Interest costs are 2.5%, and the gearing ratio of both Reits are 40% - meaning that the capital structure of the reit comprises of 40% debt and 60% equity. Both Reits have 600,000 shares issued, which gives the Reits a net asset value of $1 per share each. Up till now, both Reits have exactly the same metrics.

Now, let’s assume that as the units of both Reits are traded on the market, somehow, Reit A’s units are trading at a P/NAV ratio of 0.9x, with a dividend yield of 5.56% (assuming 100% payout). Reit B’s units are trading at a P/NAV of 1.5x, with a dividend yield of 3.33%.

What would then happen if both Reits were to look at making an acquisition?


If both Reits were to look at acquiring a property at “market value”, in this case, meaning a property that gives the same gross yield as their existing properties (4%). The target property is valued at $100,000, and the acquisition would be financed by the same debt to equity structure (40% debt and 60% equity), in order to maintain the same gearing ratio for the Reits. This is where the difference in share prices would matter to the Reits. If the discount on new shares is 10%, Reit A, has to issue 74,074 new shares to raise $60,000 of equity, whereas Reit B only needs to issue 44,444 shares to raise the same amount of equity. This means that Reit B’s cost of equity is “cheaper”, because it needs to issue fewer shares to finance the acquisition, hence resulting in lesser dilution of its outstanding shares.


When evaluating the proposed acquisition, both Reits would publish the “pro forma” financial impact of the acquisitions. Here, the capital structure of both reits remain the same (40% debt 60% equity). The gross property yield remains the same, because we are purchasing a property which gives the same yield as the existing property portfolio, and the interest cost remains at 2.5%. The pro forma impact on both Reits would be that the acquisition would be dilutive Reit A’s NAV and yield. NAV will drop to $0.98, while dividend yield, based on the theoretical ex-rights price (TERP) would be 5.50%, down from 5.56%.

On the other hand, Reit B would see its NAV rise from $1 to $1.02, and its dividend yield would increase from 3.33% to 3.44% - both NAV and yield accretive.

What would be the impact of the proposed rights issue for both Reits?

It is likely that Reit A’s shareholders would not approve the deal – nobody likes coughing up more cash, only to see their NAV and dividends get diluted. In fact, the Reit manager for Reit A might not even propose the deal to shareholders, given that it is likely to fail. On the other hand Reit B’s shareholders would likely be glad to throw extra cash at the Reit – given that the deal is NAV and yield accretive.

What can we understand from these two examples?

Fundamentally speaking, there is no difference between the two Reits, as well as the property that is to be acquired. The only difference here is that Reit B is trading at a much higher P/NAV ratio, which allows it to issue fewer shares to make the same acquisition, hence resulting in it being NAV and yield accretive. The longer term impact would be more crucial. Reit B can continue to grow its AUM with more yield accretive acquisitions, and reap benefits such as lower interest costs on its larger asset base, as well as perceived “stability” from it being a much larger Reit. The market would also view Reit B as consistently “growing”, thus may be willing to pay a premium for Reit B. This results in a positive cycle for Reit B, all of which started from the mere fact that its P/NAV was higher than Reit A.

What can Reit A do to grow?

This is not the end of the road for Reit A. It can still grow, but it would require different approaches to grow its AUM. Firstly, Reit A would probably be more selective in its acquisition targets, looking for properties that yield above market gross yields (in this case, >4%). Reit A can also consider other financing options, such as issuing perpetual securities, which count as equity instead of debt. Lastly, Reit A can also consider taking on a more aggressive financing structure for the acquisition, for example, using a 60% debt/40% equity mix, and play around with the numbers until the acquisition can be yield and NAV accretive. However, this would increase the Reit’s overall gearing ratio.

Conclusion

The conclusion here is that simply having a higher P/NAV ratio can result in tangible long term benefits for a Reit, if the Reit is able to take advantage of their “cheap” cost of equity to make acquisitions. In fact, raising equity when share prices are high is what many companies are doing, for example, fast growing companies such as Tesla or Sea Ltd have taken advantage of their high share prices to raise equity. Even meme stocks such as AMC have done the same.

Of course, there are other factors that influence a Reit’s ability to grow, such as the sponsor strength, pipeline of properties from the sponsor, capital recycling etc, but this article mainly serves to explain the impact of having a high P/NAV on acquisitions and rights issues.


Disclaimer: This article is intended for informational and discussion purposes only, and do not constitute financial advice. When in doubt, please contact a licensed financial adviser.

If you enjoy my articles, please 'Like' my Facebook Page at: 

Recent Transactions


Portfolio as of 15 Jan 2021.

Bought Valuetronics at $0.595 in late December. There has recent trend of privatisations of contract manufacturers, including Sunningdale, Hi-P and CEI Ltd, and I think that the sector deserves more attention. At the moment, I do not think Valuetronics represents an immediate takeover target, as insiders only own c.25% of the outstanding shares, as compared to Hi-P, where the insiders owned 83.% of the company when they made the privatisation offer. However, with a high net cash balance, strong track record of profitability, expansion plans in Vietnam and an improving macro situation with Biden expected to de-escalate US-China trade tensions, I believe that it may still represent an attractive company which may draw the interest of private equity firms, as the case with Sunningdale where the insiders partnered with PE fund Novo Tellus to privatise the company.

I have previously written about Valuetronics in a post here: 
http://alpacainvestments.blogspot.com/2020/06/is-there-value-in-valuetronics-sgx-bn2.html

Averaged down on Alibaba at 215 USD after the stock tanked by nearly 20% in a day after Chinese authorities announced new anti-monopoly rules against the tech giants. Average price stands at 236 USD. I still remain bullish on the long term prospects of Alibaba and the Chinese economy.

Partially exited Capitaland Integrated Commercial Trust at 2.15, and looking to divest my remaining stake before they announce their FY results this Thursday. My rationale for initiating a position was to ride on the positive news around the confirmation of the merger, and with the strong run up recently, have decided to take profit. 

The main reason is because I still have concerns over its gearing ratio and valuations of assets. Real estate valuations are often a lagging indicator, as I have written previously in this post: http://alpacainvestments.blogspot.com/2020/11/cict-should-there-be-concerns-over.html. I expect valuations of CICT's assets to fall further, with prime retail (Plaza Singapura, Raffles City) and office properties to take a bigger hit, while suburban malls expected to be more resilient, but still see their asset values decline. For some context, SPH Reit's valuation for Paragon fell by 4% from Oct 19 to Oct 20, with the reported valuation declining from 2.74b to 2.64b. Its suburban assets fared better, with Clementi Mall's valuation declining by about 2.2% from 597m to 584m during the same period. These reasons lead me to believe that the valuations of CICT's assets would decline when they report their asset values as of 31 Dec 2020. With gearing already at 39.9% as per their Q3 results, any further decline in asset values would probably push its gearing ratio to the 41-42% range, which would reduce its debt headroom. While MAS has increased the leverage limit for REITs to 50% from 45% in response to the fallout from Covid-19, this is only temporary and the leverage limit would be reduced back to 45% from 1 Jan 2022 onwards.


Additionally, the above extract from MAS' consultation paper in May 2020 indicates that MAS is concerned that retail investors are not sufficiently aware of the implications of higher leverage (higher gearing). Too often, retail investors are overly focused on the yield and yield accretive acquisitions, but less concerned about the lease decay of the leasehold properties or the gearing ratios, as I have written in prior articles. 

http://alpacainvestments.blogspot.com/2020/05/singapore-reits-do-leasehold-land.html

These should be equally crucial metrics that we look at when evaluating Reits. When asset valuations fall, and gearing ratio shoots up, it can be disastrous for investors, as seen from the case of First Reit. Of course, I am not expecting a similar situation for CICT. I still believe that reits play an important role in my portfolio, and I would prefer to look at other commercial reits with lower gearing ratios such as MCT or LendLease.

Lastly, as a word of caution, equity markets have rallied strongly over the past few months, and amidst euphoria, I think that it would be good to think about what could possibly go wrong and position ourselves accordingly. I came across this article by GMO, which I think was a pretty good read:
https://www.gmo.com/asia/research-library/waiting-for-the-last-dance/

Stay safe!

Disclaimer: This article is intended for informational and discussion purposes only, and do not constitute financial advice. When in doubt, please contact a licensed financial adviser.


If you enjoy my articles, please 'Like' my Facebook Page at: 

Follow me on Instagram at @AlpacaInvestments 

CICT (SGX:C38U): Should there be Concerns over Gearing and Asset Valuations?


In March this year, I wrote about the possibility of REITs having to raise capital through rights issues if Covid-19 were to cause severe declines in asset valuations (What Happened to REITs during the GFC?). Eight months on, this has not occurred, and although I believe that the likelihood of this has diminished, we cannot completely ignore it. In October, I initiated a position in Capitaland Mall Trust (CMT) at a price of $1.91, which has now merged with Capitaland Commercial Trust (CCT) to form Capitaland Integrated Commercial Trust (CICT). As a shareholder, I was curious to assess the likelihood of CICT having to raise capital through a rights issue, by analysing its gearing ratio and asset valuations.

I have not ran the numbers to determine the gearing ratio of the merged entity, although Kah Kiat at Dr Wealth has calculated that the pro-forma gearing for CICT would be 38.3% post-merger. However, these figures were calculated based on the valuation of CMT’s and CCT’s assets as of 31 Dec 2019. Thus, it would be appropriate to note that as of 30 June 2020, CMT’s portfolio valuation has declined by around 2.7%, while CCT’s portfolio valuation has declined by 1.7% (refer to screenshots below). Thus, the gearing ratio of the merged entity would be slightly higher than the 38.3% calculated as of Jan 2020.


Given that we’re in the midst of a global pandemic that has resulted in an economic fallout rivalling the Global Financial Crisis in 2009, I decided to take a look into history to understand how CMT’s and CCT’s asset valuations were impacted during the GFC. As I had written in my previous article, CMT and CCT both had to undertake rights issues at heavily discounted prices, which resulted in existing shareholders being severely diluted if they did not participate in the rights issue. CMT undertook a 9-for-10 rights issue in Feb 2009, raising $1.23 billion through rights priced at $0.82 per unit, a discount of 43% to the closing price of $1.45 per unit. CCT undertook a 1-for-1 rights issue in May 2009, raising $828 million through rights priced at $0.59 per unit, a 44.3% discount to the closing price of $1.06. The rationale provided for the rights issues were to reduce leverage and strengthen the REITs’ balance sheets.

I went through both CMT’s and CCT’s quarterly financial statements from 2004 till 2011, to get a deeper understanding of the economic climate leading up to the GFC, the turmoil during the GFC itself, and the recovery post-GFC. In particular, I was curious to analyse how the valuations of the REITs’ properties had changed during the entire period, and how excessive leverage was a double edged sword that worked well in good times, but detrimental to the REITs during the crisis. What I have found was pretty interesting, and I have summarised my takeaways below. On a side note, I just want to add that the Powerpoint slides back in those days were indeed hideous.


Irrational exuberance leading up to the real estate bubble: My first observation was that the run up to the GFC was indeed a crazy period. Asset valuations had increased by double digits over 6-month periods – just look at that increase in valuation of 35.1% for CCT’s Capital Tower (Currently occupied by GIC, JP Morgan and Capitaland) from Dec ’06 to Jun ’07. To compare that against our current situation, I don’t think there has been a run up in valuations of a similar scale relative to pre-GFC, thus a spectacular fall in real estate prices may be less likely. Nonetheless, even without the irrational exuberance causing a real estate bubble, we have to be cognizant of the demand side shock affecting certain classes of real estate, which may drive valuations down.

Acquiring properties during the initial stages of a crisis is generally a bad idea: As seen from the valuation figures, real estate prices are generally a lagging indicator of a crisis. Stock prices adjust downward much faster to negative future expectations as compared to illiquid assets like real estate. Thus, there is the likelihood of overpaying for real estate when making acquisitions during the initial stages of a crisis. For example, CCT’s share price peaked in May ’07, and by Jun ’08 had fallen significantly from its peak. Yet, the valuations of CCT’s assets continued to climb, as seen from the broad increase in valuations across all properties from Dec ’07 to Jun ’08, which was when the asset valuations peaked.

Acquisitions made during the GFC proved to be poor deals, as evident from the valuations of One George Street and Wilkie Edge by CCT, and the acquisition of Atrium@Orchard by CMT. The valuations of these properties declined significantly after they were acquired, thus on hindsight, if the REITs had waited a year or two, they might have been able to acquire these properties at much more attractive valuations. Thus, for REITs which have been going on a shopping spree recently (think of private placement/preferential offerings from Ascendas REIT, MLT and FCT), I am skeptical as to whether this is the right strategy.

Gearing and access to credit has to be viewed together: CCT’s gearing increased from c.30% in Dec ’04 to 42.3% in May ’09, just before it raised equity to deleverage down to 31%. On this point, I am not exactly sure on the urgent need to deleverage at that point of time in May ‘09. From my understanding, before 2015, MAS’ rules for REITs was that gearing was capped at 35%, but allowed up to 60% for REITs with credit ratings from Fitch, Moody’s or S&P. CMT and CCT had ratings from Moody’s, thus would have been able to leverage up to 60% of their asset value. Thus, with their gearing ratios at 42-43% in early 2009, I am unsure of the urgent need to deleverage through rights issues.

My guess is that it was a combination of two main factors – 1. It was extremely difficult to refinance existing debt during the GFC, as banks were wary of extending credit to REITs when the global real estate market was crashing. Thus, CMT and CCT had to raise equity to pay off the debt. 2. Perhaps REIT managers expected the sharp decline in asset valuations to continue (as seen from the double digit declines in asset values in ’09), thus they wanted to pre-empt this (even though their gearing was some distance away from 60%) in order to stay within MAS’ gearing limits.

During the GFC, I was still an oblivious primary school kid, so perhaps if you’ve invested through the GFC and have better insights on the need for REITs to deleverage during that time, please let me know in the comments below, or feel free to drop me a direct message on my Instagram page and we can have a chat. Would greatly appreciate any additional insights on this matter!

Retail properties more resilient than office properties: As seen from the changes in valuations for both CMT’s and CCT’s portfolios, CMT’s assets only recorded one period of decline in valuations, from Dec ’08 to Jun ’09. Whereas CCT’s portfolio was hit much harder, with asset values falling >20% from ’08 to ’09. To compare that against CICT’s current gearing and asset valuations, assuming CICT has a gearing of 40% currently, asset valuations would have to decline by 20% for it to breach MAS’ gearing limit of 50%. Going by history, the risk may be greater for office properties instead of retail properties. Of course, we are in an unprecedented pandemic, and the impact on retail and office properties may still surpass that of the GFC.

Closing Thoughts

I think a key distinction to make between the GFC and our current situation would be that the GFC was primarily a real estate bubble that led to a financial crisis, whereas what we are currently facing is a demand side problem cause by movement restrictions due to Covid-19. Of course, there is the possibility of the domino effect causing a real estate crisis, especially for sectors such as hospitality, retail and office, whereas sectors such as logistics and data centres have been doing well.

A mitigating factor for CICT would be that the enlarged asset base provides some form of diversification, as retail properties have shown to hold their assets values better than office properties during the GFC. With regard to the impact of WFH policies on commercial property valuations, my view is that the downside would be limited. As we have seen, tech firms have still been taking up prime office space in the CBD, and ultimately, I believe that there would be some form of equilibrium between WFO and WFH. Offices would not be redundant so soon. Additionally, as I have written in my previous article – Will WFH change real estate trends? – I believe that the land that commercial properties occupy still hold significant value. As we have seen from the redevelopment of Funan Mall, integrated developments seem to be the way forward, and office properties may potentially be converted to integrated developments (subject to zoning restrictions) if remote working does indeed threaten the existence of office buildings.

To conclude, with CICT’s gearing level at approximately 39%, I am slightly concerned as it is a relatively high level compared to its historical average. Recently, we have seen FCT using part of its $575m raised from its private placement to pay of a $325m revolving credit facility and an $80m bank loan. Personally, I would prefer that the REIT manager acts to reduce CICT’s gearing ratio, perhaps via a private placement to reduce its debt position slightly, even though the MAS gearing limit for REITs was recently increased from 45% to 50%.

If you've read to this point, and are still keen to learn more about REITs, I have written two other posts about Singapore REITs here:

1. How do we analyse REITs?

2. Do leasehold land tenures matter for valuations? 

Note: As of writing, hold a long position in CICT at an average price of $1.91. 

Disclaimer: This article is intended for informational and discussion purposes only, and do not constitute financial advice. When in doubt, please contact a licensed financial adviser.


If you enjoy my articles, please 'Like' my Facebook Page at: 

Follow me on Instagram at @AlpacaInvestments 

Singapore REITs: Do Leasehold Land Tenures Matter for Valuations?


I had intended to write on this topic for the longest time, but school commitments meant that this was put on hold. With an entire month ahead before my internship begins, time is aplenty for me to do more in depth research into companies and sectors, so watch this space closely for more articles!

Recently, a conversation with someone on Reits led to the discussion on this topic – whether the underlying land tenure of a Reit matters when making an investment decision. In short, I believe that it does, even if this detail is often overlooked by investors, who may prefer to focus on the yield instead. I believe that while looking at the yield of a Reit is important, we should also consider the underlying land tenure of the Reits’ assets as an important decision making metric.

In this article, I would discuss the implications of the different land tenures for different classes of properties, focusing on the comparison of industrial assets against retail and commercial assets. In addition, I would also discuss the importance of looking at the average age of the properties – another metric that I believe investors tend to overlook. The average age of the properties is related to the underlying land tenure, and I believe that investors should consider both factors simultaneously when evaluating a Reit. I hope this article challenges the status quo of simply looking the dividend yield, NAV and price to book ratios, which I believe is myopic and would lead to issues in the longer term.

Firstly, I’d like to start off with the leasehold vs freehold debate. For the longest time, rightly or wrongly, many Singaporeans have held the belief that their HDB flats/Condos/Landed properties would be ever appreciating assets. A common belief was that even as a leasehold HDB/Condo ages, there would somehow be an opportunity to exit via an en bloc, or that HDB would want to redevelop the estate and compensate the owners. In 2017, many who held this belief received a wake up call when Minister Lawrence Wong cautioned that Singaporeans should not assume all HDB flats will be eligible for SERS – in fact, as of 2017, only 4% of HDB flats were identified for SERS since it was launched in 1995. I have included the article here:


Mr Wong’s comments were in response to the trend of buyers increasingly forking out high prices for HDB flats that had relatively short land tenures left, in anticipation of SERS. His comments sparked quite a debate at that point of time, as it corrected the notion that leasehold assets would continue to appreciate indefinitely. Hence, buyers of HDB flats became more aware of the implications of having a short lease tenure left. The first batch of leasehold properties in Singapore have already been returned to the Singapore Land Authority – in short, when the lease runs out, the land reverts to the state, with zero compensation to the owners. You may read more about this here:


Therefore, if buyers of HDBs and Condos consider the remaining land lease tenure and the properties’ age when making investment decisions, then logically, the same decision making framework should be applied when we are evaluating a Reit as a potential investment.

Land lease tenures of different types of properties

In Singapore, Retail and Commercial properties are usually on 99 year leases, with a minority of them on 999 year or freehold tenures. For industrial properties, before 2012, industrial properties were sold with 60 year land leases, which was cut to 30 years in 2012. Since 2019, certain newer industrial sites for ‘heavier industrial use’ were sold with only 20 year leases.


Looking at things from an IRR perspective

In real estate, we usually evaluate the merits of an investment using the internal rate of return (IRR). The IRR of an investment takes into account the initial capital invested, and the cash flows that we receive during the period that we hold on to an asset. The higher the IRR, the better.

To simplify things a little, consider this hypothetical situation where we have two HDB flats, one with 30 years left on the lease, while the other has 99 years left on the lease. Assume both are now selling for $500k each, and yielding 5% a year, which is 25k.

From an IRR perspective,

For the first property, we are investing 500k today at a 5% yield, and will receive 25k a year over the next 99 years. The IRR would be 4.96%. I used a financial calculator to calculate this, but you can also use the calculations using the ‘=IRR’ function on excel, or find an IRR calculator function online.

For the second property, we are investing 500k today at a 5% yield, and will receive 25k a year over the next 30 years. The IRR would be 2.85%, which is much lower than the first scenario.

Therefore, from an IRR perspective, the first property is definitely the better investment, because we are collecting the rental payments over 99 years instead of 30

Now, you would be thinking: Why would anyone buy the second property, when we can get a much higher IRR by buying the first property? Surely the second property would have to provide a higher yield (and hence, sell at a lower price), in order to compensate for the shorter land tenure left?

If you think this doesn’t make sense, this is exactly what’s happening in the markets now, where the yields of industrial /logistics reits are comparable, or sometimes even lower, than the yields on retail and commercial properties. 

Of course, due to the current Covid-19 situation, prices of retail and commercial reits have been pressed down, and it would not be a fair comparison. I agree that it would not be fair to make a comparison now, but even if we were to look at prices in late 2019 and early 2020, before the Covid-19 outbreak, industrial reits have been trading at yields which are comparable to office/retail reits. Some industrial reits were trading at yields of high 4%, while some office and retail reits were trading at yields of low 4%.

So how do we explain this unique situation? Mitigating factors 1 and 2 provide some possible reasons.

Mitigating Factor 1: Industrial rental growth to outpace office/retail rental growth?

Investors who are bullish on industrial reits may argue – industrial rents are going to outpace office and retail rents due to the e-commerce trend, which results in an increased demand for logistics and industrial space. In fact, some may even hold the view that office rents will fall due to WFH being a long term trend, while the lockdown would accelerate the downfall of retail. These perspectives make sense, but considering the much shorter land tenures of industrial land (30 – 60 years), how much more can the rents increase to compensate for the shorter land tenure, in order to make the IRR from the investment in industrial assets comparable to the IRR from office/retail assets? And if you’re expecting industrial assets to somehow be worth more than office/retail sometime in the future, wouldn’t landlords of malls simply convert their empty malls into storage spaces?

Additionally, industrial/logistics reits may also be perceived to be more resilient in times of uncertainty. This is due to their long WALEs which ensure that landlords lock in their rental rates for a longer period of time. To me, the ‘safety’ of industrial/logistics reits are not entirely convincing. The long WALEs are only applicable if the tenants are still in business. While it may be correct to claim that industrial and logistics tenants are benefiting from the e-commerce trend and the current lockdown, there are certain groups of tenants who may also be affected in the current downturn. Firstly, consumer discretionary businesses who face bankruptcy may default on their warehouse rental payments – for example, if a clothing store goes bankrupt, it is unlikely that they would pay for rental owed to the landlord of their warehouse. Secondly, SMEs in the manufacturing sector who are in more cyclical sectors (oil and gas, aviation etc) are also at risk. These SMEs rent manufacturing space from industrial reits too, and may run into cash flow problems.

Overall, yes, while ecommerce companies like Amazon or third-party logistics providers like DHL may benefit, there are certain tenants of industrial and logistics reits that are at risk as well. Hence, the stability of industrial reits may be overestimated.

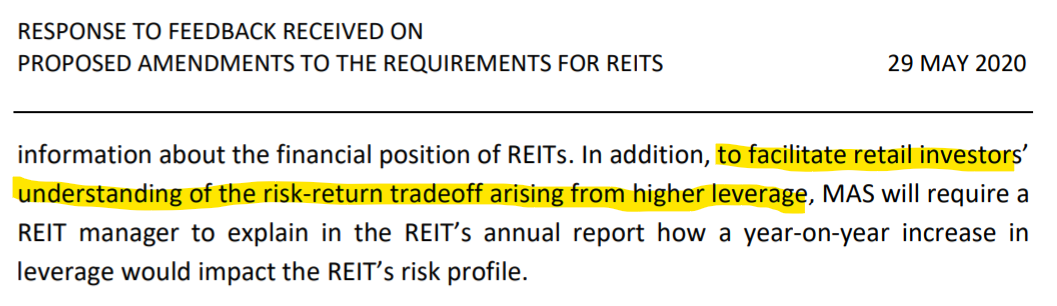
Mitigating Factor 2: Will industrial/logistics reits be able to renew their land leases upon expiry?

I have found the answer here:


To summarise, generally, the Govt’s position is to allow the leases to expire without extension. This is because Singapore is land scarce, and the Govt would want to be able to reallocate land to meet changing socio-economic needs. However, there would be exceptions granted, such as if significant investment has been made on the property, but these would be evaluated on a case by case basis.

If the Govt does indeed grant an extension, the landowner would still have to pay a land premium to obtain the extension of the lease. If the reit is able to win approval to extend its land lease tenure, that would affect the IRR calculations, hence we would not discuss this in depth here, given that there is no certainty of this happening in the first place.

Further metric to consider: Age of the properties

This brings me to the second point that I would be discussing – the age of the buildings themselves. While we have earlier discussed the lease tenure of the assets, practically, it would be unrealistic to expect the buildings to last the entire duration of the lease tenure. For example, an office building built on a 99-year leasehold land would not be expected to continue to be in use at the end of the 99 years. At some point in time, wear and tear takes a toll on the building, and newer buildings built with better technology become more attractive to tenants. This trend has already played out in Singapore’s CBD, as the newer buildings (MBFC, Marina One, Asia Square, ORQ etc) have attracted tenants to move away from the ‘traditional’ CBD area of Raffles Place. In part, this is due to the larger floor plates in the newer buildings which allows tenants to optimise their office layouts, and the newer amenities.

Hence, what would be a reasonable age of a building before we can expect a property to be redeveloped? Going by the precedent cases, URA had launched the CBD Incentive Scheme in 2019, which aims to rejuvenate the city centre. Some of the properties identified to benefit from this scheme would be Shenton House and International Plaza, which were built in the late 1960s and early 1970s. As these buildings are still standing today, it would be reasonable to conclude that commercial properties can be expected to last at least 50 years before they are slated for redevelopment.

However, there are also properties which undergo redevelopment or major asset enhancement initiatives much earlier, for example, Chevron House was sold by Oxley to real estate fund AEW for $1.025 billion. Chevron House is currently undergoing major asset enhancement works which is expected to cost around $100 million. Chevron House was completed in 1993, which means that the building is approximately 27 years old at the point of commencing the major uplift.

Thus, if you’re buying a Commercial/office reit that owns properties with average ages of 20+ years, in practice, you’re probably only getting the rental payments for another 30-40 years, before it would be scheduled to undergo major redevelopment works, even if the land lease tenure is 99 years or longer. That means if the reit does not sell off the property to a third party, past the 30 year mark, there could potentially be more redevelopment or asset enhancement costs for unitholders.

What’s the ideal outcome for investors?

Having discussed the implications of both the leasehold land tenure and the age of the assets themselves, what would be the best outcome for reit investors? The two issues discussed above may have painted a rather bleak picture for reits, but I still believe that reits have a place in our portfolios, as they provide exposure to real estate, and in ordinary situations, provide a steady stream of income to investors.

The ideal scenario for reit investors, which would mitigate the effects of a short remaining land tenure and an older portfolio age, would be if the reit is able to continually make yield accretive acquisitions over time. These new acquisitions, assuming that they are assets with long land tenures and newer properties, would continue to allow the reit to increase its portfolio average land tenure, while lowering the average age of its properties.

Here’s the catch – acquisitions funded by rights issues would mean that the investor has to come up with the cash to subscribe to the rights. However, if the acquisition is yield accretive, then the investor who does not want to come up with the cash may choose to sell his rights, as the yield accretive acquisition means that his dividends would not be diluted. Alternatively, reits may raise cash through a private placement, usually to institutional investors or high net worth individuals. Generally, if the private placement is intended to fund a yield accretive acquisition, then it is beneficial to existing unitholders, as private placements are usually done at a lower discount than rights issues, so there is less dilution for all unitholders. In short, existing unitholders would be benefiting from the capital of new unitholders.

Furthermore, reits may also take a proactive asset management approach, selling off their older properties to recycle capital into newer assets.

Conclusion

While investors are right to look at popular metrics such as dividend yield, DPU growth, NAV and price to book values, I believe that it would be appropriate to consider the land tenure of the properties and the portfolio average age as well. The leasehold nature of properties is more common in Singapore, whereas for reits that hold overseas assets, those properties tend to be freehold assets. Hence, only the issue of average portfolio age would be applicable to these reits. Some examples include Manulife Reit’s US Office portfolio, which are 100% freehold, while Frasers L&C Trust’s Australian logistics portfolio are freehold as well.

I have complied the land lease tenure of a few popular reits in the table below. While researching on the data, I realised that most reits do not specifically state the age of their properties. However, we can simply calculate it by referring to the date of completion of the properties, which are provided in the annual reports.


Source: Various Annual Reports, Quarterly Presentations

As discussed, the land lease tenures of industrial properties are usually shorter than retail and commercial properties. Hence, it would be logical for industrial reits to provide investors with a higher yield, in order to compensate for the shorter land tenures.

Taking this into account, it would be good if investors consider the land tenures and building age when making investment decisions. While there are macro factors (as discussed in Mitigating Factor 1) that are positive for industrial reits, in situations when industrial reits are trading at similar yields to commercial and retail reits, it would be wise for investors to ponder whether the market has priced in and accurately accounted for the shorter land tenures of industrial assets.  

Note: As of writing, I do not have any positions in any of the securities mentioned in this article. From time to time, I may take up positions in the aforementioned securities, without updating this blog.

Disclaimer: This article is intended for informational and discussion purposes only, and do not constitute financial advice. When in doubt, please contact a licensed financial adviser.


If you're keen to learn more about REITs, I have written two posts here:

If you enjoy my articles, please 'Like' my Facebook Page at: 


Follow me on Instagram at @AlpacaInvestments


Mapletree Commercial Trust 4Q Earnings Briefing: What I've Learnt


I’ve always wanted to experience listening in on an earnings call with a company’s management, and to be able to observe how analysts question the company’s management on the specific operating metrics and the outlook of the company. Last week, I attended Mapletree Commercial Trust’s 4th quarter analyst briefing via webcast. I felt that it was an insightful discussion as it provided a bit more colour on the performance and the outlook of MCT’s assets, and the management had discussed further details that were not present in the earnings presentation and financial statements.

Here’s a summary of the 7 things I’ve learnt:

Source: MCT 4Q Results Presentation


1. Headline numbers were the increase in revenue and NPI by 12.6% and 12.8% respectively, from 4Q‘18. This was mainly due to the increase in contribution from the acquisition of MBC ll completed in 3Q 2019, offset by a decrease in revenue from VivoCity, due rental rebates given to tenants as a result of the Covid-19 circuit breaker measures.

2. Distribution per unit (DPU) fell by 60% to $0.91 for 4Q, due to a 42.1 mil capital allowance claim and a 1.6 mil retention of capital distribution. Management explained that the intention of claiming a capital allowance against the distributable income was to reduce the distributable income, which means that MCT would still comply with the rule that REITs must distribute 90% of their distributable income, in order to enjoy tax transparency. Management also mentioned that retaining this amount of cash was a prudent move, as cash flow is paramount during this crisis. In the event that the retained distribution is not utilised, MCT would pay out the amount as a capital distribution to unitholders, which is tax exempt.

3. Operational metrics: Portfolio committed occupancy was maintained at 98.7%. Questions were asked regarding the tenant profile of MCT, and whether certain office tenants have been affected by Covid-19, in addition to retail tenants. Management indicated that there are certain office tenants in the tourism related sector who may be affected.

There was also interest in the new Covid-19 (temporary measures) Bill passed by the government, and a question was raised regarding how many % of tenants are expected to use the Bill. Overall, management expects c.10% of tenants (by portfolio revenue) to apply to seek shelter under the Bill, mostly from the retail segment, and a small portion of the office tenants in the tourism sector as mentioned in the previous paragraph.

Regarding the number of tenants still open in VivoCity currently, management responded that around 30%, or about 100 of the 350 tenants are still in operation, but most would not be trading at normal levels.

A question was also asked regarding the percentage of tourists numbers for the Vivocity’s shopper traffic. Management replied that based on the survey done 2 years ago, tourist shopper traffic was about 20%, but would be different today.

4. Tenant relief package: MCT has given tenants a total relief package worth c.50 mil, which is equivalent to approximately 3.5 months of rental. This 50 mil package also includes miscellaneous rebates such as waivers for using the atrium space or car park rebates. Management shared that MCT is the only REIT that that gave tenants visibility on the rental relief measures up to July, hence it would not be a fair comparison to compare their current value of the rental relief package against that of other REITs, as other REITs have yet to announce their respective rental relief measures for June or July.

As a follow up on the point about rental relief, MCT indicated that the respective share of the total rental relief package worth 3.5 months of rental were 1.1 months from the government’s property tax rebates, and about 2.5 months which is MCT’s contribution.

An analyst also asked whether the security deposits from tenants were intact even with the rental rebates. Management replied that the rental rebates were in the form of waived rents, hence the security deposits are still intact.

5. Valuation issues: An analyst asked if the valuation of properties were too optimistic, given that the portfolio valuation remained flat at $8.9 billion, as there were no change in cap rates used. MCT’s NAV stood at $1.75 as of March 2020. Management’s response was that the valuations of the assets are done by independent valuers, and factors such as comparable transactions and current and future rents are taken into account. Valuers are taking the Covid-19 as a one-off thing, hence there is minimal impact on the long term valuation.

6. Capital management: MCT has refinanced all term loans due in FY ’20, with only a $160 mil MTN due in Aug 2020. Debt maturity profile is well distributed, with no more than 17% due for refinancing in any financial year. MCT has $321 mil of cash and undrawn committed facilities on hand, while. MCT’s debt headroom increased to 1.5 billion, after MAS increased the gearing limit for REITs to 50%. MCT’s relatively low gearing ratio of 33.3% means that it has the ability to increase its debt if required.

7. Outlook: With regard to rental renewals, management noted that 18.8% of leases are up for renewal in this FY, with 8.1% and 10.7% coming from the retail and office segments respectively.

Overall, I felt that dialing in to the earnings call by the management was very insightful. It provided me with a better understanding of the key metrics that equity research analysts were looking out for, and I would definitely be attending more earnings calls in the future.

For the full transcript, I have included the link below:


If you're keen to learn more about REITs, I have written two posts here:

Note: As of time of writing, I have divested my position in MCT.

Disclaimer: This article is intended for informational and discussion purposes only, and do not constitute financial advice. When in doubt, please contact a licensed financial adviser.


If you enjoy my articles, please 'Like' my Facebook Page at: 
https://www.facebook.com/AlpacaInvestments/


Follow me on Instagram at @AlpacaInvestments

How Do We Analyse REITs - A detailed look at factors driving a REIT's value


Real Estate Investment Trusts (REITs) are highly favoured by investors here due to the steady stream of dividends paid out to shareholders. For the good part of the last decade, investors have viewed REITs as quasi-bond instruments, paying out a steady stream of dividends on a quarterly or semi-annual basis. Without much volatility for REITs throughout the last decade, except for the Eurozone debt crisis in 2011, the Fed’s Taper Tantrum in 2013 and the oil price crash in 2015, REITs have rewarded investors fairly well during this period, with a good number of REITs outperforming the Straits Times Index on a total return basis.

‘This time it’s different’ is an extremely dangerous phrase to use in the financial markets; an exceptional run up in prices over 2019 had pushed REIT prices sky high, and as recently as a few months back, some investors were seeing 3-4% yields from REITs as a ‘new normal’, fueled by low interest rates and an insatiable hunt for yield. So much so that some investors have taken this lack of volatility for granted, building up leveraged positions on REITs in order to extract higher income. Bear in mind that REITs are already leveraged vehicles themselves, usually around a 40% debt, 60% equity structure, hence, if one were to further leverage their position on a REIT, that would result in a double leveraged position for the investor. Resulting in one big fat margin call when prices crash. 

Given the keen interest on REITs among retail investors, especially with the sharp selloff over the past three weeks, I decided to write in greater detail about how I look at REITs.

The reason I picked LendLease Global Commercial Reit for this case study was simply because they only have two properties currently (313 Somerset and an office complex in Milan), hence it would be much easier to project the rental revenue with just two properties. Please note that I learnt these valuation methods on my own by reading books or from online sources, mostly before entering university (I’d say 90% of the concepts). Doing these valuation case studies in university probably only trained me to be more cognizant of the formatting, such as colour coding certain figures etc, because these would be relevant if you’re looking to pursue a career in buyside roles or investment banking. Thus, if I overlooked any areas, I’ll apologise in advance and please do point them out to me. 

Please note that the following case study is for informational and learning purposes only, and should not be taken as financial advice regarding LendLease REIT’s shares. All figures and estimations used in the following case study are for illustration purposes only is not a solicitation to transact in LendLease REIT’s shares. When in doubt, please approach a registered financial advisor for advice.

Let’s now take an in-depth look into a REIT’s financial statements:

Revenue Drivers

Firstly, a REIT’s current revenue is determined by these main factors:

1. The rental rates per square feet – usually expressed as per square foot per month (psf/month)

2. The total Net Lettable Area of the property (NLA) – usually expressed in square feet

3. The occupancy rate of the properties – as a percentage of the total NLA

The REIT’s rental revenue for each property can then be calculated by multiplying these three figures, on an annualised basis.

A REIT’s future revenue would mainly be driven by rental reversions, which may be positive or negative. Alternatively, the REIT may undertake acquisitions or asset enhancement initiatives (AEI) to increase their NLA, rental rates and/or occupancy rates. These would form the projections for the REIT’s future rental revenue.


In this example, LendLease’s Milan property has a 12+12 year lease with annual rental escalations tied to the ISTAT CPI growth rate in Italy. Hence, I used a 1% growth rate for projecting the annual rental growth rate. For 313 Somerset, due to the recent COVID-19 situation, I projected that rental rates would fall by 20% in 2020 before recovering in 2021. Do note that a 20% fall is an extremely bearish scenario, as typically a REIT would not renew all its leases in a single year. Hence, assuming a REIT renews 20% of its leases at a 20% decline in rental rates, the overall impact on the rental revenue would only be a 4% decline. However, I used a -20% figure just to get a sense of the impact of an extreme scenario.

Profit and Loss Statement

Once we have projected the REITs rental revenues, the next step would be to estimate the expenses that the properties and the REIT manager incurs.


Net Operating Income (NOI)

In real estate, net operating income is a key metric used to evaluate and value properties. NOI is calculated by deducting all property expenses from rental revenue. NOI margin is expressed as a percentage of total rental revenue. As seen from the financial projections above, the Milan Property has a much higher NOI margin than 313 Somerset. This is mainly because the Milan property is on a triple net lease, which means that the tenant pays for most of the property operating expenses.

Capitalisation Rates

Following on from the NOI discussed above, capitalisation (cap) rates are used to value properties, and cap rates can be compared across similar properties. Think of cap rates as being similar to earnings yield, which is the inverse of the price-to-earnings (P/E) ratio. Basically, when comparing two properties, the property with the lower cap rate means that it has a steeper valuation, assuming that they both have the same NOI. A caveat here would be that we should not simply take the cap rates of similar properties and apply it to the property we’re valuing, as in the case of leasehold properties, this method would not account for the remaining land lease tenure of each property.

For example, a property with a remaining lease tenure of 50 years, generating an NOI of 1mil, valued using a 5% cap rate would give a 20mil valuation. But if we have an adjacent property that also generates an NOI of 1mil but with a remaining lease tenure of 10 years, surely we won’t value that property at a 5% cap as well, and the cap rate used would have to be much higher to account for the extremely short lease tenure left.

In this case study, LendLease’s external valuers valued 313 Somerset at 4.25/4.50% cap rates. For a comparison, CapitaMall Trust’s Plaza Singapura is valued at a 4.50% cap rate. The reason I picked Plaza Sing for comparison is because both malls are in the Orchard Road area, and both malls sit above an MRT station, which gives them a premium. As 313 has a 99 year leasehold tenure commencing in 2006, while Plaza Sing is on a freehold tenure, taking into account the long lease tenure left, the variation isn’t that huge, and the cap rates for both properties might be said to be comparable, the slightly lower cap rate for 313 might be due to 313 being a much newer mall than Plaza Singapura.

Managers fees

This component is usually overlooked when investors discuss about REITs, but should be an important factor to consider as well. This Straits Times article has compared the manager’s fee structures of the various REITs here.


For LendLease REIT, the main recurring management fees are as follows:

1. Management fee of 0.3% of per annum of the value of Lendlease Global REIT’s Deposited Property

2. Performance fee of 5% of NPI

3. Trustee’s Fee of of up to 0.015% per annum of the value of the Deposited Property

The main reason for discussing manager’s fees would be the alignment of interest with shareholders. When the manager owns a stake in the REIT, it aligns their interest with shareholders as they are incentivised to see the REIT perform well. Managers usually take fees in the form of cash and shares, in this case, LendLease’s manager has elected to take 100% of the fees in shares for the first 2 years. However, managers taking fees in shares would also dilute existing shareholders, hence it is imperative that there is also DPU growth to offset the dilution effect. Here there’s a trade off between dilution and the alignment of interest.

Debt, Interest expense and Interest Coverage Ratio

Debt financing forms a huge part of a REIT’s capital structure – and has to be delicately managed. Too little debt, and it means that shareholders are not maximizing their income as more debt can be deployed to acquire more properties, in order to generate higher rental income. Too much debt, and the issue of servicing the debt and meeting regulatory requirements arises. Singapore REITs have a 45% gearing limit, which means that total debt cannot exceed 45% of the REIT’s total assets. There has been discussions about raising this 45% limit by MAS, but nothing is confirmed at this point. The issue of high leverage increases the risk of exceeding the 45% gearing limit if property prices were to crash, which was what happened during the Global Financial Crisis of 08/09. REITs would then have to turn to rights issues to raise capital. I have written an article on this as well. REITs during GFC.


Interest expense here is calculated simply using the weighted average cost of debt multiplied by the total amount of outstanding debt. This is certainly a rough estimate of the interest expense, but if you’d want to be more specific, you may want to look at the individual financing sources and their specific interest rates. Regardless, REITs would ideally want to keep their funding costs low, as this means more income available for distribution to shareholders. On this point, most REITs would also hedge their interest rate exposure, mainly through swaps to ensure that they would not be affected by rising rates in the near future. Conversely, given the current direction which interest rates are heading, the lower rates means that REITs which have swapped their debt for fixed rates would benefit little from this trend.

The interest coverage ratio (ICR) measures how many times of interest expense can be covered by the REIT’s profits before interest and tax. In times like these, rental revenue is uncertain as some tenants may default, and a higher ICR is better as it gives the REIT a greater buffer in challenging times. LendLease has an extremely high ICR of 10.8x, mainly due to its low borrowing costs.

Outstanding shares

This is linked with the earlier section about management fees paid in units, as paying mangers in the form of units would enlarge the number of shares outstanding. This would dilute the existing shareholders, but ideally, rental growth is able to keep pace with the increase in number of shares to ensure that distributable income per share continues to grow.

Valuation – Dividend Discount Model


In a dividend discount model (DDM), we are basically valuing the future dividends that a REIT distributes and discounting them to their present value. I’d like to say that personally, I’m not exactly a fan of using a DDM, as the valuation is extremely subjective and sensitive to the inputs. For example, using a terminal growth rate of 1% or 2% makes a huge difference to the implied valuation. However, this method is still widely used in the industry, and to be honest, what’s a viable alternative?


In this case study, I simply used a discount rate of 7.5% to 8.0%, and a terminal growth rate of 1.5%. One might also choose to use an exit cap rate method to obtain the terminal value, but I feel that method is slightly more difficult to appreciate and hence would not be elaborating on that here.

Additional factors beyond the financial statements

Lastly, there are additional qualitative and macro factors that might affect the valuation of the REIT.

1. Sponsor strength: REITs with reputable sponsors generally enjoy more stability, as the financial strength of their sponsors may give investors some assurance during challenging times. It is also important to look at the REIT’s pipeline of their right of first refusal (ROFR) properties. Basically, a ROFR clause means that if the sponsor wants to sell one of their properties, it would first have to offer the REIT the opportunity to purchase the property on a willing buyer, willing seller basis.

2. Macro factors: Is the REIT’s assets mainly in Australia? Or the UK? Or Europe? This would expose investors to FX volatility. You might want to take a view as to whether these economies would do well in the near future.

I hope this article has been informative, and do share it with someone who you think would find this useful as well!


Note: As of time of writing, I do not hold a position in LendLease Global Commercial REIT

If you enjoy reading my articles, please 'like' my Facebook page to receive all the latest updates. It would also mean a lot to me if you could share my articles on Facebook. Thank you! 


Follow me on Instagram at @AlpacaInvestments

Please note that these articles are for discussion and informational purposes only and should not be relied upon as financial advice. Readers should consult their licensed financial advisers before making investment decisions. Please read the full disclaimer available on the desktop version of my blog.